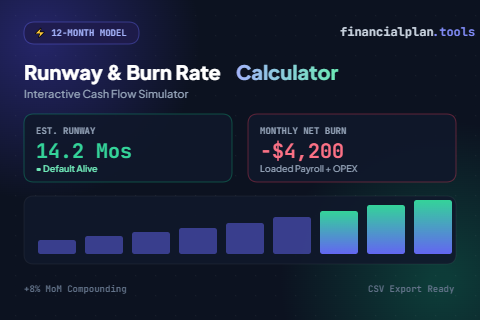

Free Startup Runway & Burn Rate Calculator (Plus 12-Month Projection Guide)
Calculate your runway, simulate revenue compounding, and determine your exact cash break-even point in real time.
Running out of cash is the second most common reason early-stage companies fail. Yet, many founders still rely on rough back-of-the-napkin math—simply dividing current cash by last month’s expenses and calling it a day.
In reality, businesses are dynamic. Your revenue compounds, payroll fluctuates, and operating expenses scale alongside growth. To get an accurate reading on your financial buffer, use the live 12-month projection calculator below to test assumptions, inspect burn rates, and identify your “default alive” trajectory.
Test Your 12-Month Financial Projections
Adjust core growth drivers below to see how your runway and net burn respond in real time.
Key Drivers
12-Month Outlook
How These Projections Are Calculated
Uses your Month 1 baseline and compounds monthly growth across 12 periods: Rm = Rm-1 × (1 + Growth Rate).
Calculates fixed annual burn by summing monthly team compensation and software/overhead: (Payroll + OPEX) × 12.
Measures your true capital erosion over 12 months: Total Expenses − Total Revenue. If revenue exceeds costs, the net burn stays at $0.
Divides current bank reserves by monthly net burn: Cash ÷ Monthly Net Burn. Once revenue surpasses monthly expenses, trajectory shows as Profitable.
How Startup Runway Actually Works (Beyond Simple Math)
Your runway is the number of months your business can continue operating before running out of funds, assuming revenue and expenditure follow projected trajectories.
Runway (Months) = Current Cash Balance ÷ Monthly Net Burn Rate
While this basic formula works for quick estimates, it overlooks three critical realities of an operating business:
- Compounding Revenue: As your customer base grows month-over-month, incoming cash increases and progressively compresses your monthly burn rate.
- Staged Headcount Expansion: Hiring an additional developer or sales lead midway through the year permanently alters your expense baseline.
- Variable Operating Costs: Customer acquisition costs (CAC) and server infrastructure naturally scale alongside top-line revenue.
Gross Burn vs. Net Burn: Understanding the Difference
When preparing reports for partners, lenders, or investors, knowing the distinction between gross and net burn is essential:
Gross Burn
The total cash going out the door every month, ignoring incoming revenue entirely.
Formula: Payroll + Software/OPEX + Marketing + Cost of Goods Sold (COGS)
Why it matters: Demonstrates worst-case exposure if top-line revenue were to drop to zero.
Net Burn
The actual net cash depletion from your account each month after incoming receipts.
Formula: Total Monthly Cash Inflows − Total Monthly Cash Outflows
Why it matters: This is the true metric that determines how quickly cash reserves disappear.
3 Common Traps Founders Face in 12-Month Forecasting
- Assuming Linear Month-over-Month Growth: Projecting 10% monthly growth is realistic from $2,000 to $2,200, but maintaining 10% when hitting higher revenue volumes requires exponentially more top-of-funnel lead generation.
- Underestimating Fully Loaded Payroll: Base wages do not equal total payroll expense. Always account for employer taxes, benefits, tooling, and onboarding overhead (typically adding 15%–25% to gross salaries).
- Waiting for 3 Months of Runway to Plan Next Steps: Securing loans or closing an equity funding round takes 3 to 6 months on average. If your runway drops below 6 months, immediate corrective action—such as reducing non-essential OPEX or accelerating sales cycles—is required.
Recommended Runway Targets by Business Stage
| Company Stage | Target Runway | Primary Objective |
|---|---|---|
| Bootstrapped / Pre-Seed | 6–12 Months | Reaching organic break-even or initial product-market fit |
| Seed Stage | 18–24 Months | Validating unit economics and repeatable acquisition channels |
| Series A / Growth | 18–24 Months | Scaling infrastructure, sales teams, and operational efficiency |